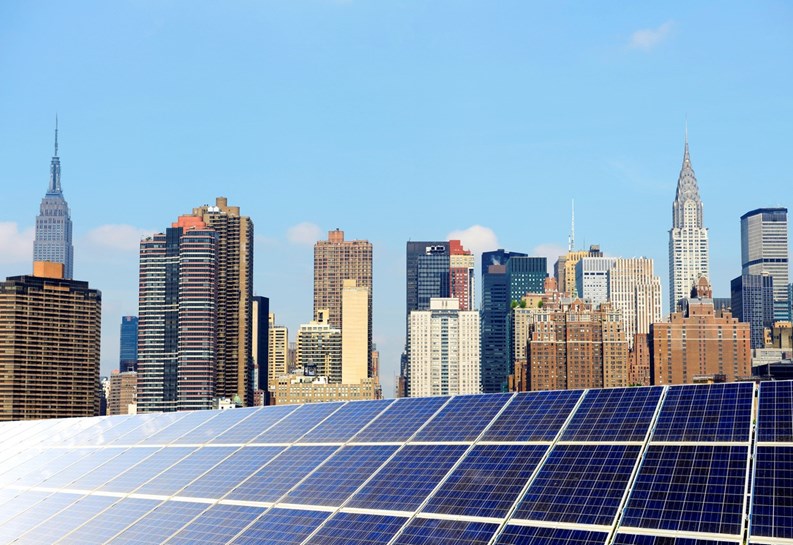
Over the last few years in New York, there has been a push to get as many people on renewable energy as possible. Last September, Mayor Bill de Blasio announced that New York City was looking to increase its goal of solar power capacity to 1,000 megawatts by the year 2030. According to the mayor’s office, that amount of solar power capacity can “meet the power needs of more than 250,000 households.”
As a part of that push, the City University of New York (CUNY) has teamed with New York City, New York State, and the Department of Energy to create the first statewide solar map and portal.
“It's the first statewide map and portal where everything is together. When we did the New York City map, at that time, it was the largest LIDAR (Light Detection and Ranging)-based map. Now there's a lot more,” says Laurie Reilly, communications director with Sustainable CUNY.
Accessible at nysolarmap.com, the NY Solar Map measures a number of different things. Perhaps the most relevant to community organizations is the solar radiation map, which can estimate how much energy an individual building can generate.
“People can put in their own address, or their work address, and see what's going on in their borough in terms of solar capacity. Or if you're in another town or village outside of New York City, you can see what's going on in your area,” says Reilly.
For example ,the building that houses The Cooperator can potentially generate about 15.29 kilowatts on a sunny day, and has about 1,040 square feet of usable space for solar panels, according to the map.
“This map is never to replace having an installer come out and do the actual analysis of your roof, but it gives you a pretty good idea of what your capacity could be,” Reilly says.
How the Information Is Gathered
According to Reilly, the map is able to generate this information by taking a map of the city and overlaying it with LIDAR data collected by airplanes over the city.
“At that time we started,” she explains, “there wasn't a lot of LIDAR data, and New York City didn't have any. So we started with that and actually flew the planes in a grid to collect the points of data. It was almost like shrink wrapping the city.
“As time went on,” Reilly continues, “more and more counties and areas got their own LIDAR. But in building this particular map, we would still have to do quality assurance of the LIDAR information in different areas. We added on the exact capability in certain areas, and the rest of the state.”
Finding Out About Solar Programs
In addition to the basic solar radiation data, the map also gives information about programs residents in the area can participate in.
“For example, if you're in the Bronx and you go to that, and you hit in your area, you can see that, ‘Oh, I have an opportunity through Here Comes Solar or a couple of other programs.’ We try to make it really easy for people,” says Reilly.
Along with giving you such information as solar statistics and solar potential after you input your address on the solar map, “you have the opportunity to connect to a solar installer, if you want to,” Reilly adds. “You can take it to the next step, and you can choose how you want that.”
The portal also has the various steps that need to be taken in order to install solar panels on a building’s roof. At the moment, the portal features interactive guides for New York City, Red Hook, Yonkers, Huntington, Clifton Park, and the Village and Town of Warwick. Of course it doesn't mean you should immediately replace the work of a contractor, but nevertheless this gives a basic idea if you are considering going solar.
John Zurz is a staff writer for The Cooperator and other publications.


Leave a Comment